
A trilingual clinic site that loaded like a brochure.
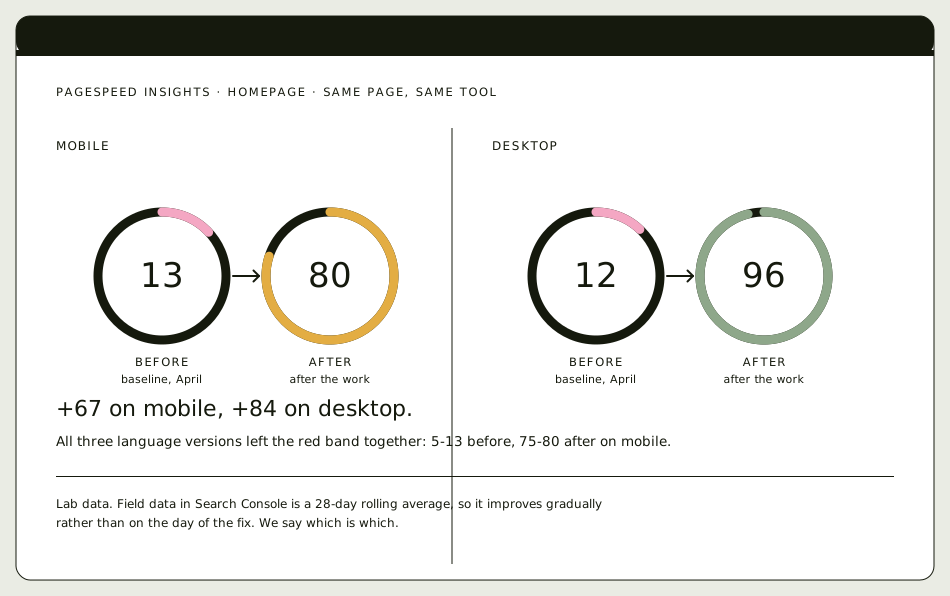
Thirteen out of a hundred on mobile, on a site people reach for on a phone late at night. No redesign: the same site, made to load.

PageSpeed Insights, same page, same tool
Same measurement, same fortnight
All three moved out of the red band

The problem
A private healthcare provider running one WordPress site in Thai, English and Chinese. The mobile homepage scored 13 out of 100 on PageSpeed Insights, and the English and Chinese versions were worse at 7 and 5. People reach for a site like this privately, on a phone, often late at night, and the alternatives are one tap away. It was not broken in any way a visitor could name. It was just slow enough that some of them left before it appeared.
What we did
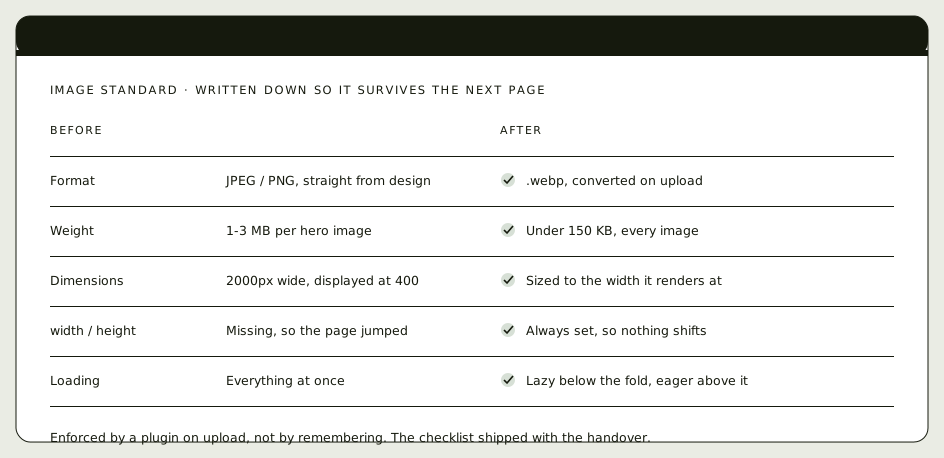
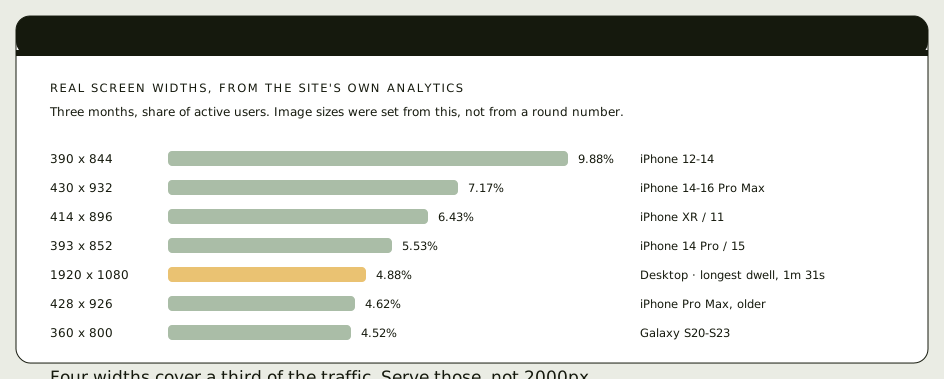
A technical audit against the live site rather than a redesign proposal, then the fixes in priority order: the mobile hero swapped from an autoplaying slider to one static image, a real image standard enforced on upload (.webp, under 150 KB, dimensions set so the page cannot shift), lazy loading everywhere except above the fold so the largest element still renders immediately, unused themes and plugins removed, and the image widths set from the analytics rather than a round number. The infrastructure work that follows is handed over with the reasons attached rather than quietly bundled in: managed hosting, a CDN per language, an object cache, and PHP 8.2.
The result
The mobile homepage went from 13 to 80, desktop from 12 to 96, and all three language versions left the red band together. The service and blog templates moved too, which matters more than the homepage here: those are the pages search actually sends people to.

Diagrams we drew from the measurement report, on a plain document background. No screenshots of the live site, and no client named: this was delivered white-label for another agency, so the name is not ours to share.
Audited the live site in all three languages, on mobile and desktop, and recorded a baseline before touching anything.
Ranked every finding by impact against effort. The mobile hero, the image pipeline and the lazy-load configuration came first; the hosting migration was named and deliberately left for later.
Shipped the fixes on the existing WordPress install. No replatform, no redesign, no new template.
Re-measured the same pages with the same tool: mobile homepage 13 to 80, desktop 12 to 96, and the two template types that matter for search moved with them.
Want the same numbers on your own site?
Thirty minutes, no pitch. You give us the URL when you book, we run your PageSpeed score and the AI visibility test before we speak, and you keep the findings. This case stays unnamed: it was freelance work for another agency, so the name is not ours to give.
